Performance overview
In the modern digital ecosystem, where seamless user experiences and operational efficiency are paramount, optimizing application performance is a fundamental requirement. OutSystems offers a comprehensive array of tools and strategies dedicated to enhancing application performance across various dimensions.
Table of contents
- Ability to handle high loads and concurrent users
- Performance metrics, dashboards, and APIs
- App usage and performance real-time insights
This chapter delves into how the OutSystems platform supports application performance optimization, ranging from robust handling of high loads and concurrent users to sophisticated data management capabilities. It explores the platform’s effective techniques for handling heavy batch processing, ensuring efficient data storage, and using data caching mechanisms. Furthermore, it emphasizes how OutSystems delivers responsive user interfaces and cross-device compatibility, along with insights into enhancing application development efficiency through design-time validation, code optimization, and containment.
The chapter also highlights the OutSystems commitment to platform stability and reliability, underscored by its advanced monitoring, analytics, and real-time insights capabilities, empowering users to achieve optimal performance results while maintaining a resilient and scalable application infrastructure.
Ability to handle high loads and concurrent users
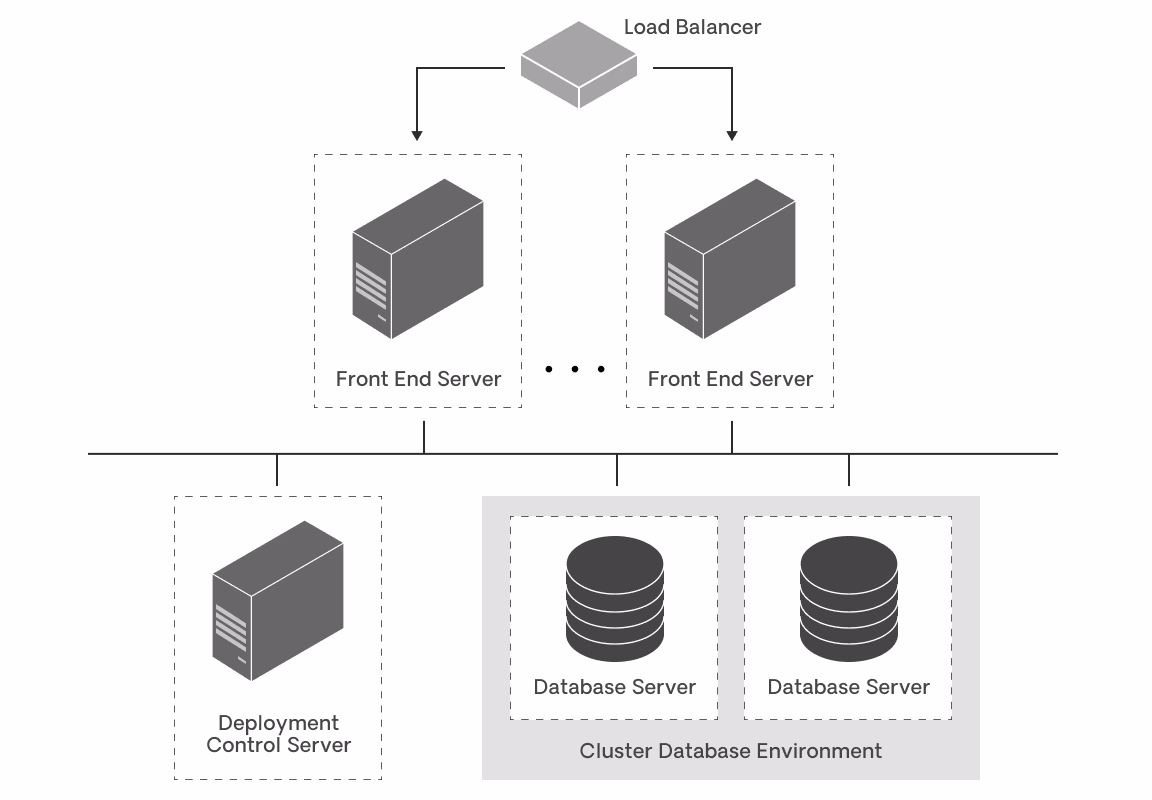
Using the OutSystems cloud-native architecture, applications are by default prepared to handle a massive number of users. Companies in industries like telecom, insurance, and healthcare have been using the OutSystems low-code platform to create applications with very high loads. In fact, the very first OutSystems customer was a telecom company, so transactional performance has been a platform priority from day one.
To enable this, OutSystems extends standard web application server stacks. This enables teams to use traditional scaling strategies like:
- Horizontal and vertical scaling
- CDN (content delivery networks)
- Load balancing
- Reverse proxies
- Database clustering
Furthermore, OutSystems automatically optimizes application source code. Even when developers don't meticulously focus on this optimization, the OutSystems platform streamlines the amount of information transferred and processed, handling only what is essential for the application.
Performance metrics, dashboards, and APIs
With OutSystems, applications are automatically instrumented to create error, audit and performance logs so you don't have to. At runtime, these metrics are captured asynchronously, so that the performance of applications is not compromised while they create a constant stream of metrics.
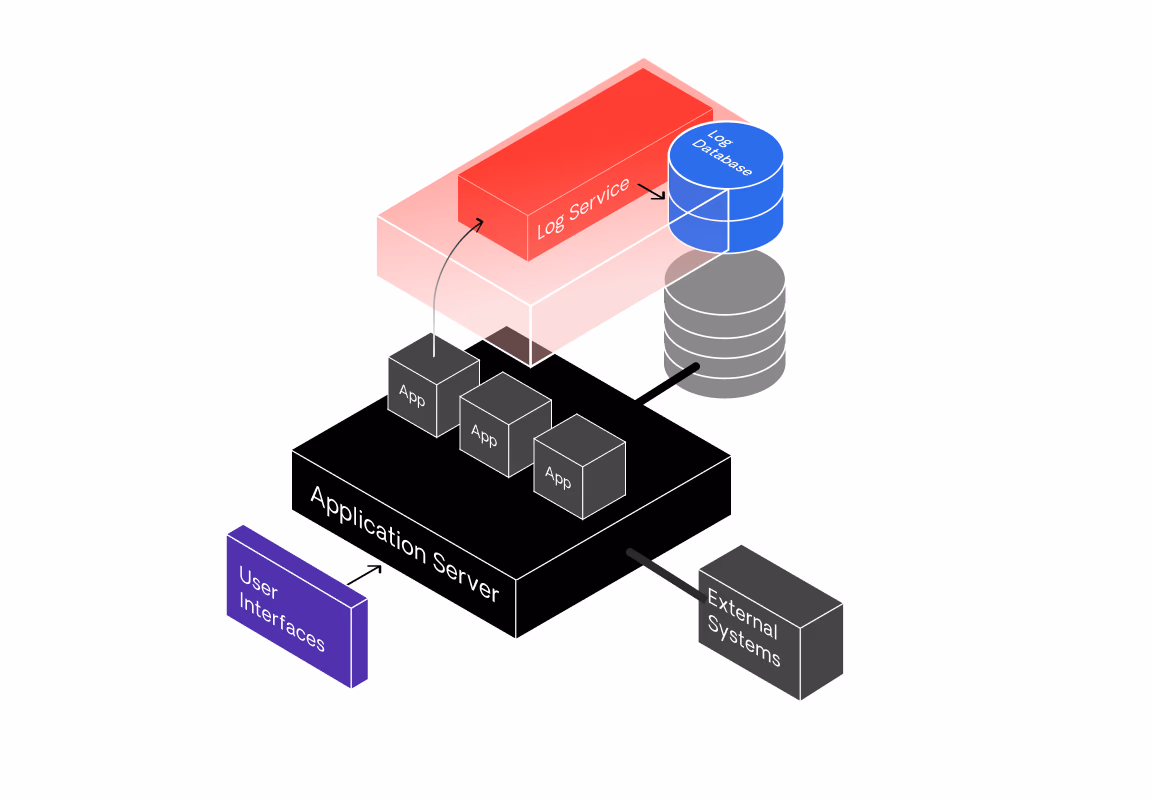
The log service runs at a lower priority, so that it doesn't compete with normal application processing. At runtime, when an application generates an error, audit, or performance event:
- The event is written to a standard message queue on the front-end server.
- The log service running on the front-end server asynchronously retrieves the events from the message queue and adds them to the logs repository.
- Monitoring consoles can then use these events to display errors, audits or performance data. They can also be sent to external systems by using available APIs.
OutSystems also has a rich performance monitoring dashboard that makes it easy to understand performance bottlenecks and take action. The goal is to help teams quickly and efficiently address any issues that might arise.

This dashboard leverages the OutSystems logging repository and correlates information that's useful and easy to interpret, such as which database queries are affecting the performance of a specific screen. This eliminates the need for manual correlation steps and provides immediate insight.
The dashboard also automatically surfaces issues that teams did not see coming, such as slow screens or extensions. This reduces the time it takes to resolve them, so teams can focus on creating new applications, not troubleshooting them.
It's possible to explore how the performance of the apps is affecting the end-user experience. Teams can drill down and see the performance of an application on the:
- Client: where they can also check the most used operating systems and browsers.
- Network: where they can check the most used network connections and data carriers.
- Server: where they can check for slow database queries and slow integrations.
All the insight from the analytics capability of OutSystems is then publicly exposed in a flexible, easy-to-use, REST API. The API enables access to all registered events in real-time for seamless integration with other enterprise management solutions. It also enables you to register custom events.
App usage and performance real-time insights
OutSystems features visual representations and detailed trend analysis, as well as AI-driven support to assist developers in swiftly pinpointing the root causes of issues, conducting impact assessments, and expediting service restoration. This results in heightened efficiency and productivity for development and operations teams. Furthermore, OutSystems adopts open telemetry standards, facilitating seamless integration with third-party application performance monitoring (APM) tools.
Learn more about tracking the health of OutSystems applications