OutSystems Analytics for agent and app performance monitoring
Get a 360º view of your entire app and agent portfolio—so you can catch issues before they become problems. With the power of AI and OpenTelemetry at your fingertips, you can spot and solve problems in minutes, not hours. Work smarter and deliver cloud-native apps and custom agents users will love—all with the trust, security, and compliance your enterprise requires.
 BENEFITS OF APP ANALYTICS
Simplify agent and app monitoring
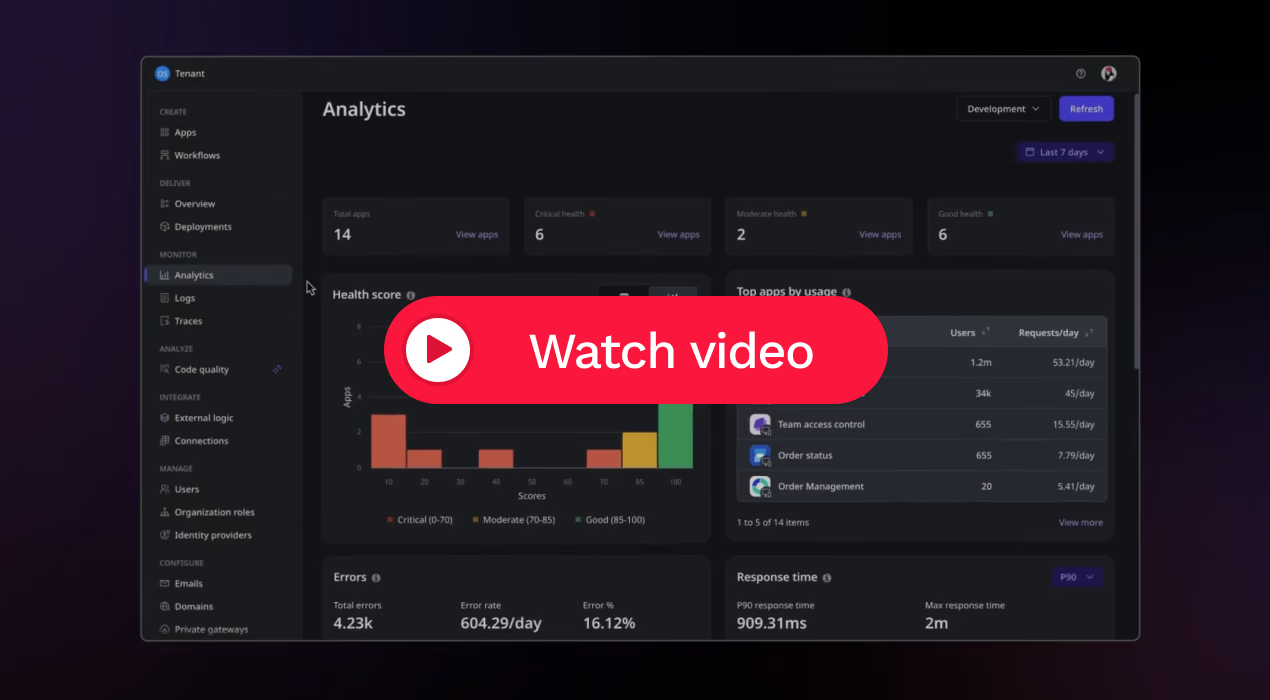
Get full-stack observability and monitoring, no manual instrumentation, data mapping, or complex integrations required. Gain real-time insights into app and agent performance and token usage. With end-to-end monitoring and complete telemetry—logs, traces, and metrics—across all dev stages, you can identify issues fast, troubleshoot with ease, and optimize for a superior user experience.
Build performant apps and reliable agents with less effort
Deliver winning apps and agents with confidence knowing that you have a full view of your portfolio's health. With built-in AI-driven capabilities that audit your apps and agents for performance and accessibility throughout the development process, OutSystems makes it simple to produce high-quality apps and reliable agents.


“The DevOps capabilities of OutSystems, like one-click deployment and performance monitoring, mean the apps we deliver this way are less costly to update and maintain. That means we can invest more in innovation that will keep the company competitive into the future.”
Tony O’Halloran, Director of IT, Total Produce
Discover the Tech Behind Total Produce's SuccessGet a unified view into agent and app performance with one tool
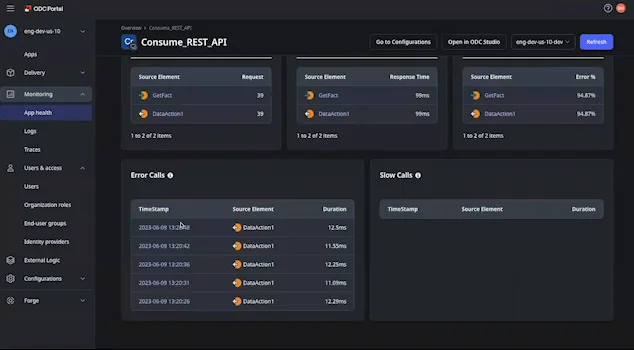
Tired of jumping between tools to understand what’s happening across your portfolio? Automate performance monitoring with OpenTelemetry and pull together data from your entire portfolio—apps, agents, and telemetry infrastructure, plus user experience insights—all in the OutSystems portal or the APM tool of your choice.

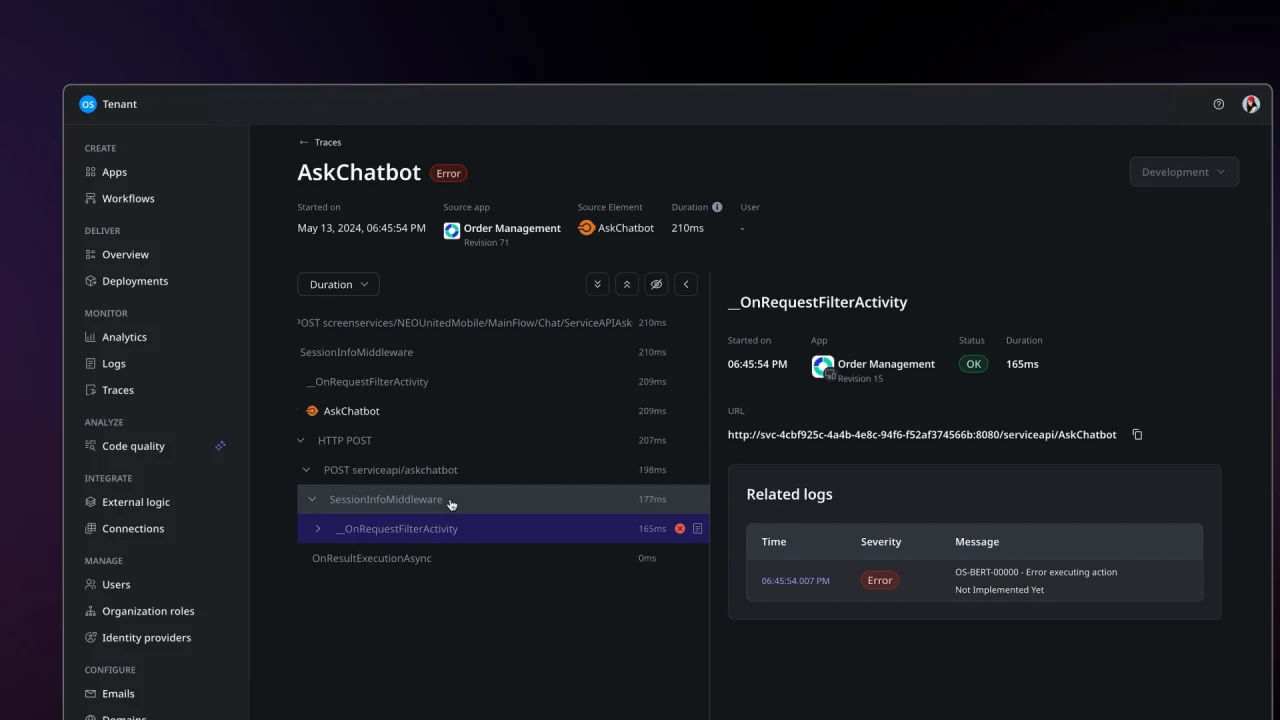
Improve developer productivity through simplified DevOps
Pinpoint issues easily and speed up troubleshooting using automated root cause analysis that reduces Mean Time to Recovery (MTTR). Dive into performance with intuitive app-, agent-, and element-level drill-down views to quickly identify performance issues—no debugging or guesswork required.
Turn user data into better experiences
Utilize user experience data to better understand user perspective on your app performance. Leverage these insights for troubleshooting scenarios and to implement improvements that align with user needs. Client-side traces and digital user experience analytics gives you what you need to exceed user expectations and stay ahead of the competition.

 MORE OUTSYSTEMS PLATFORM RESOURCES
Build what’s in your backlog
The broadest range of use cases, templates, and powerful partner solutions help you tackle everything in your application backlog.
Visit our use case librarySee how OutSystems stacks up
Get the latest research on low-code platforms from global industry analysts and see why OutSystems is known as the #1 AI-powered low-code platform.
View recent analyst reportsGo deeper into the platform
Get more details about how your team can build mission-critical applications fast. Browse our evaluation guide.
Learn more about the platform